Resiliency Engineering Builds Upon Reliability Engineering


By way of background information, resiliency engineering builds upon reliability engineering, a sub-discipline of systems engineering, which is an interdisciplinary field of engineering and engineering management that focuses upon how to design, analyze, and manage complex engineered systems over their life cycles. Reliability engineering focuses upon the ability of a component, multi-component assemblies, multi-assembly sub-systems, etc. to perform their required functions, within their specified environments, for a specified period of time without failure. While reliability engineering does indeed account for the time to fail for a component, multi-component assemblies, multi-assembly sub-systems, etc. while they are in operation, it does not account for the time necessary pertaining to any repair actions that may take place.

Availability, testability, maintainability, and maintenance are core constituent components of reliability engineering. Typically, reliability engineering looks at preventing failures, such as by changing maintenance management strategies, which are divided into three main classes: corrective maintenance, preventive maintenance, and predictive maintenance. Corrective maintenance allows the involved system to operate until the component, multi-component assemblies, multi-assembly sub-systems, etc. fails, and the item is replaced after the failure occurs. Preventive maintenance is time–based maintenance; it is based upon the notion of performing the service or overhaul after a pre-determined period of time (i.e. optimally close to, but prior to the estimated shelf-life of the component); however, if the maintenance is performed biannually, there could be a six-month blindspot between each maintenance cycle. Predictive maintenance is based upon the core concept that to avoid failure, ongoing estimates of the potential of failure for the various components are performed; this requires condition monitoring.

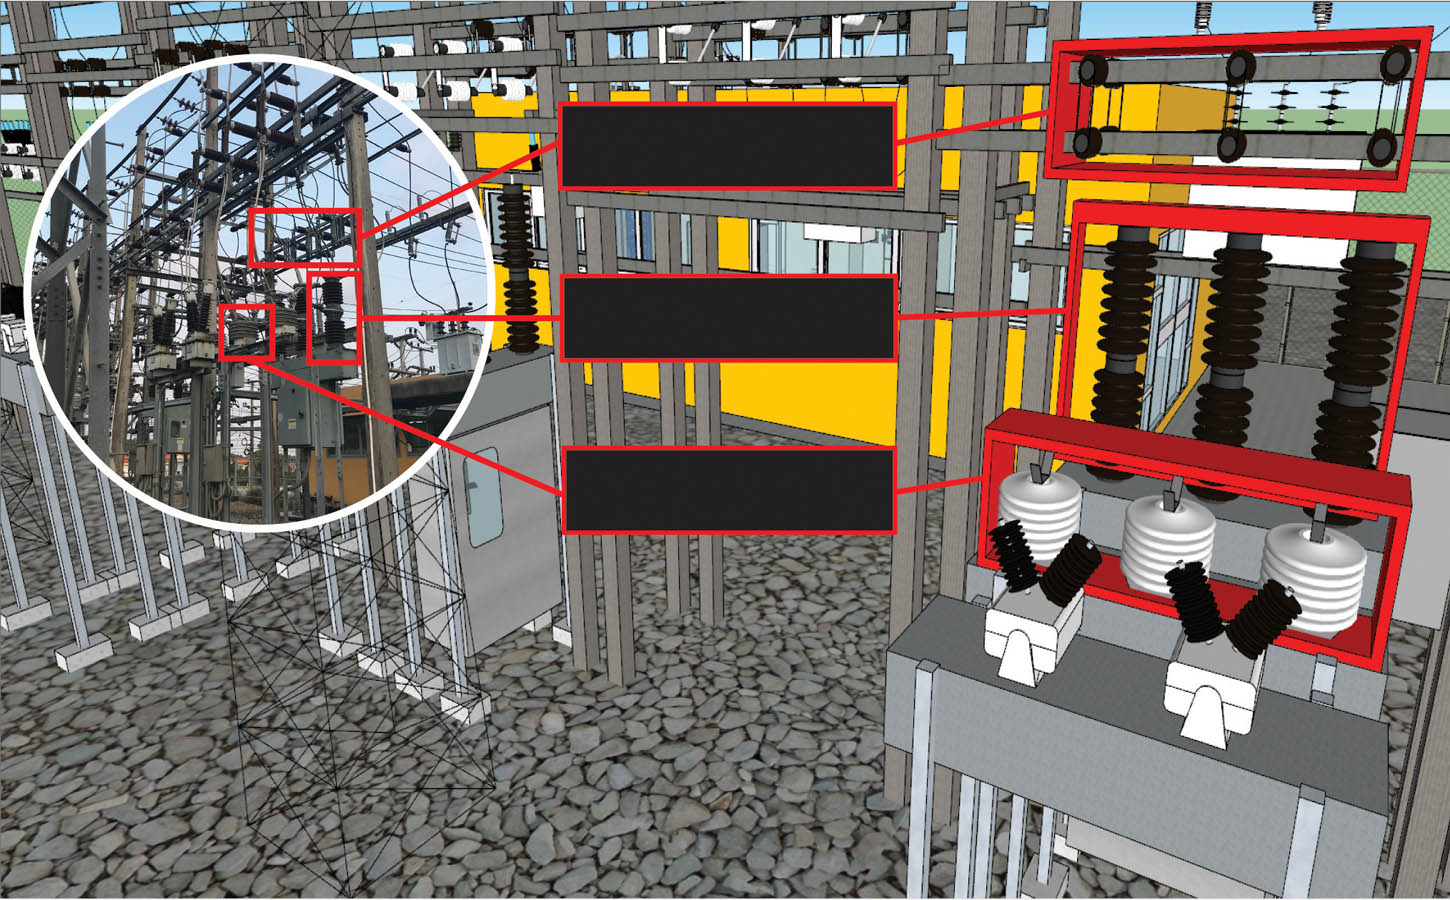
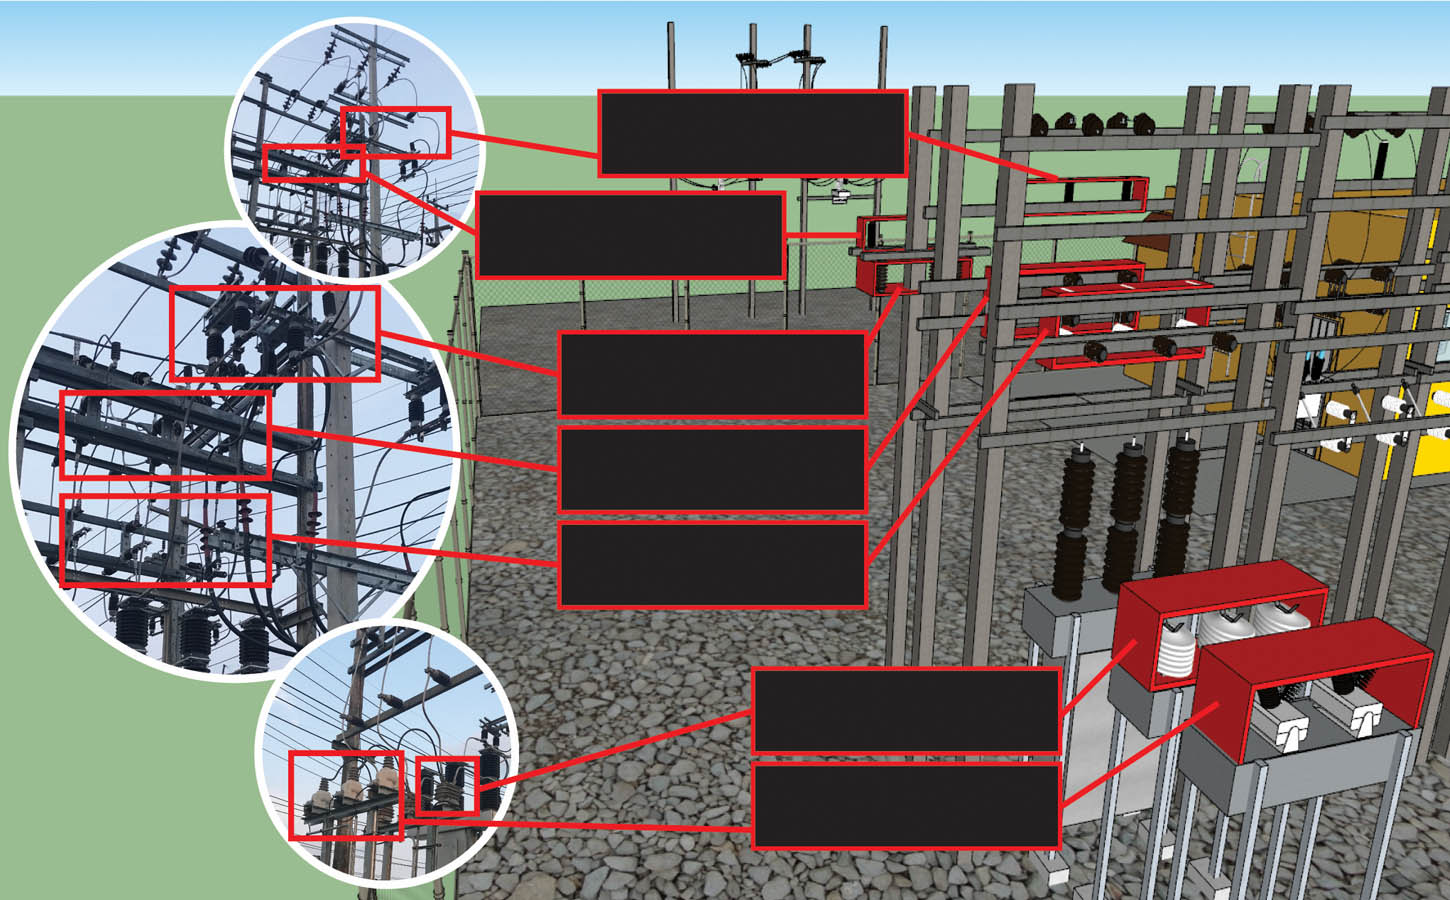
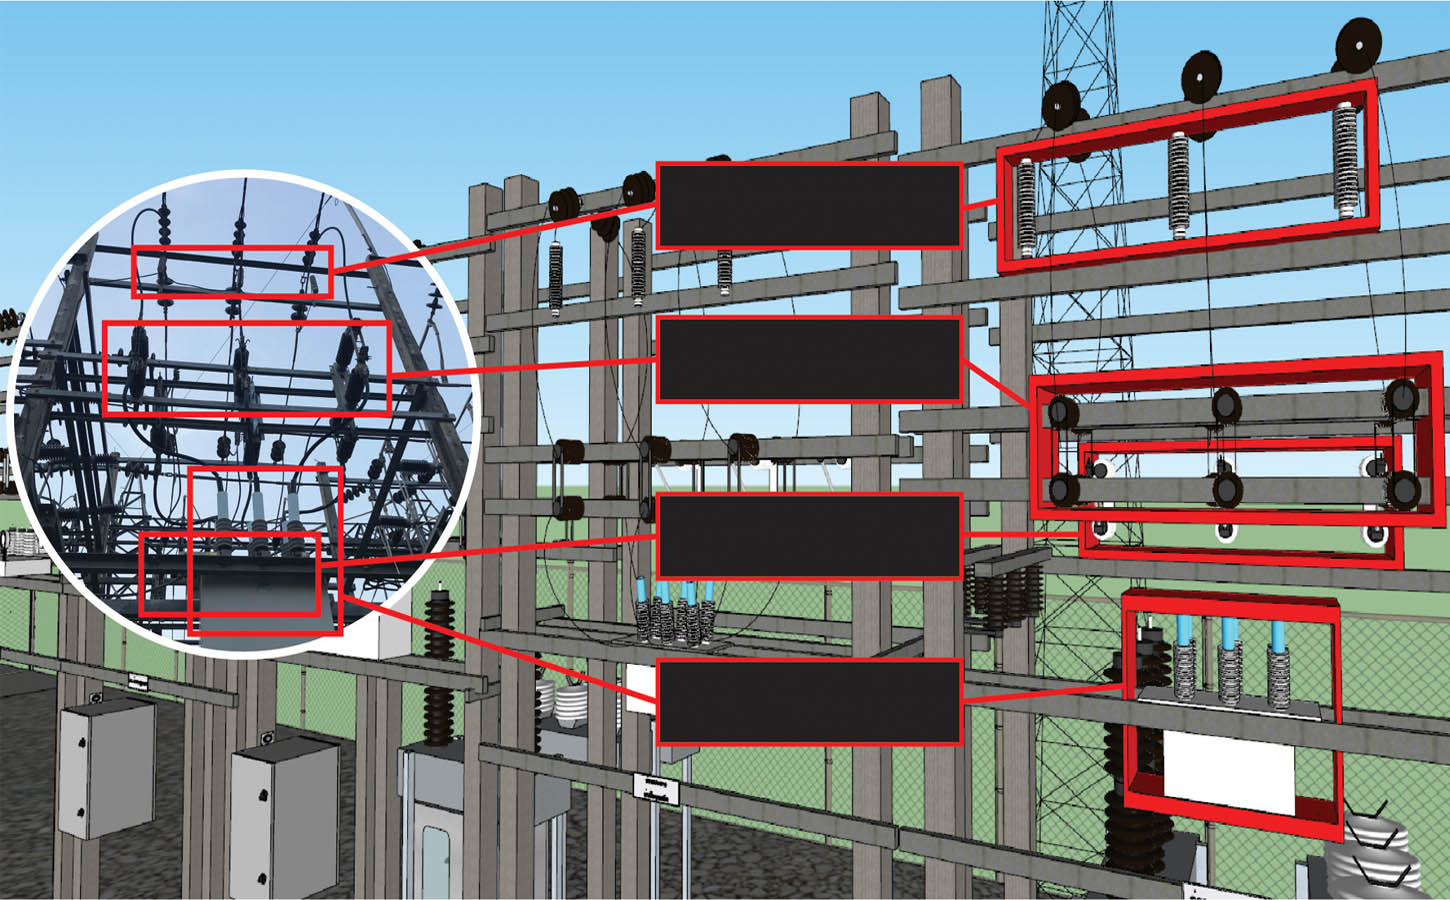
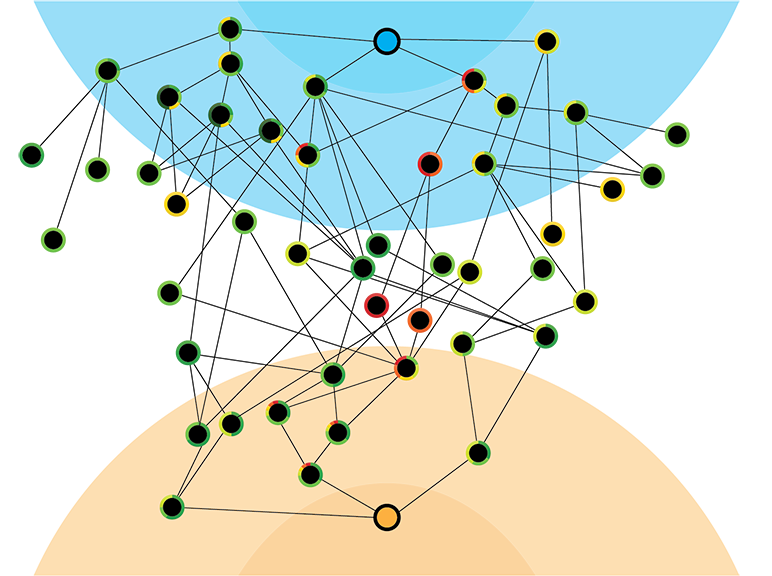
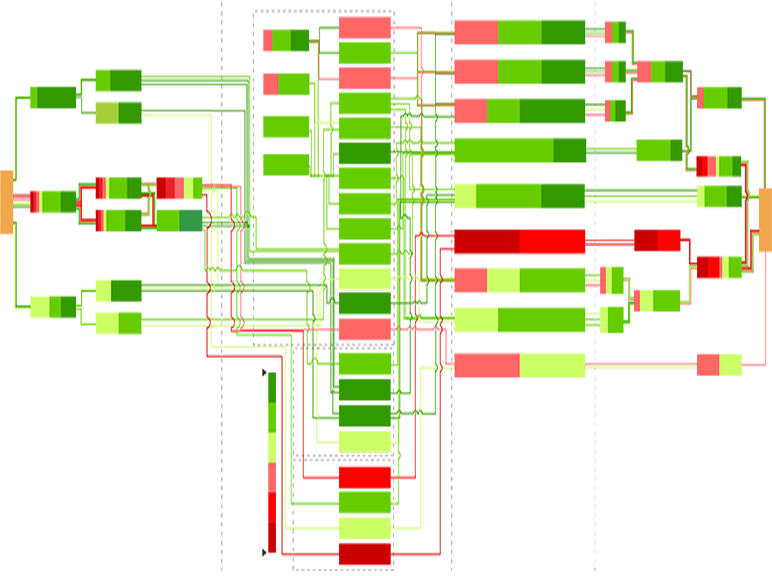
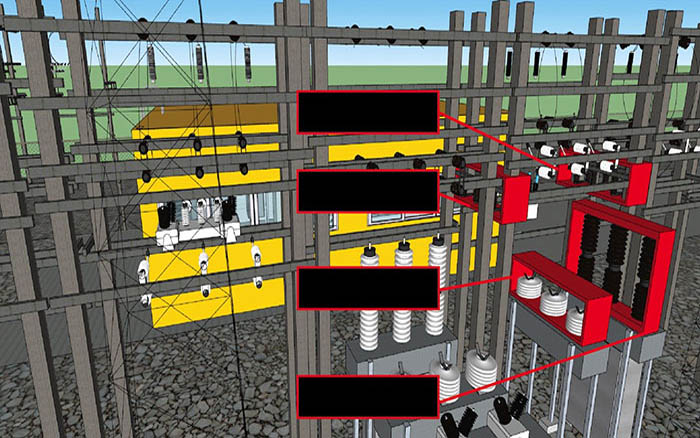
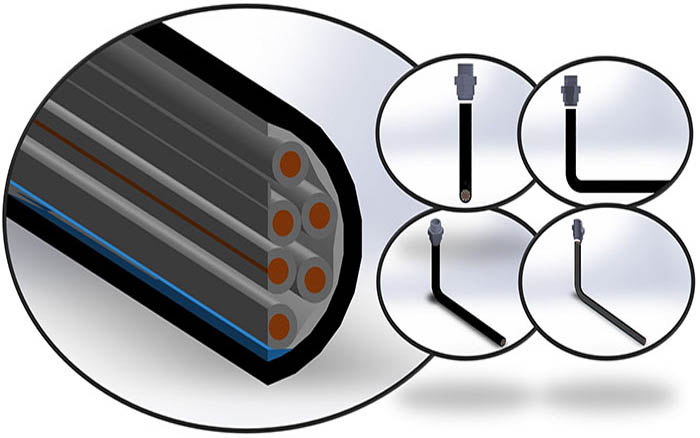
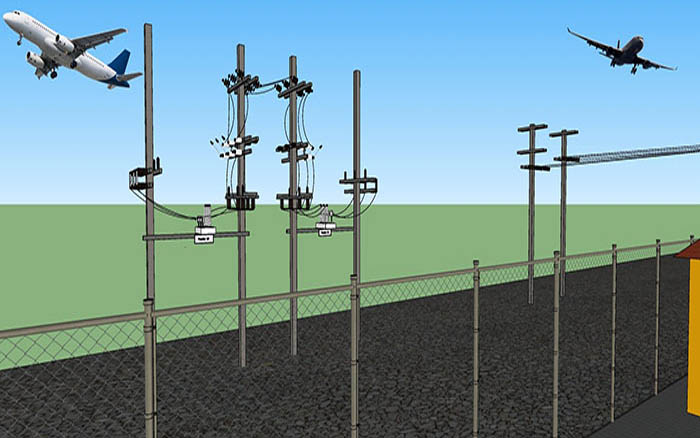
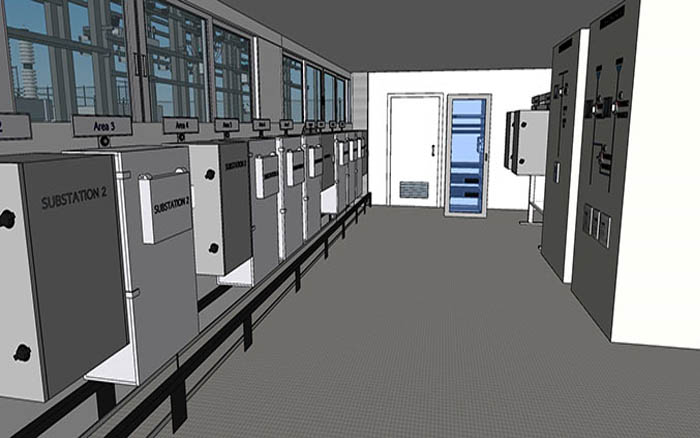
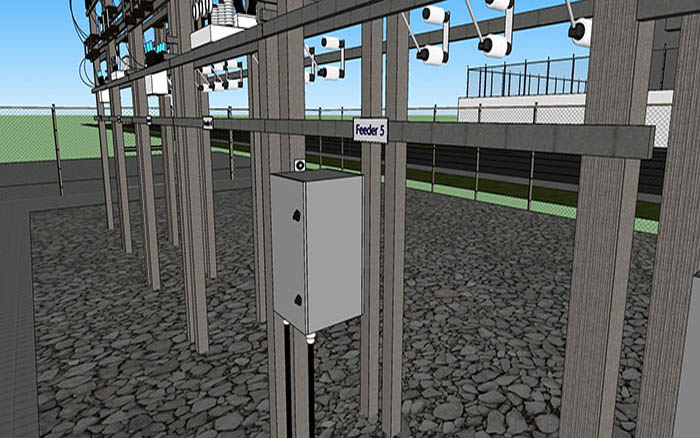
Apart from maintenance, maintainability centers upon the ease and speed with which the involved system can be restored to operational status after a failure occurs. If backup components are not available and need to be ordered, maintainability would be low. Next, testability refers to the ability to run a robust simulation to test a supposition. This requires a robust, granular understanding, such as exemplared in Figures 1a through 1d below, of the various components, multi-component assemblies, multi-assembly sub-systems, and systems (leading up to the involved system of systems) so as to conduct a realistic simulation.

Figure 1a

Figure 1b

Figure 1c

Figure 1d

Robust understanding of Key Components


Finally, availability refers to the degree to which the various components, multi-component assemblies, multi-assembly sub-systems, systems, and system of systems are operating properly when they are requested for use at an unknown, unspecified time. Specifically, availability is the probability that a system is not in a failure state or undergoing a repair action when it needs to be used. It might seem that if a system has a high availability then it should also have a high reliability. This is not necessarily the case. Indeed, the relationship between availability, maintainability, and reliability can be seen in Figure 5, and as can be seen in the second to last row, an increase in availability and an increase in maintainability does not necessarily lead to an increase in reliability.

Figure 2
Relationship between Reliability, Availability, and Maintainability (RAM)


For example, if the increase in availability is only 1% and the increase in maintainability might only be 1%, this may not cross a certain threshold to necessarily lead to an increase in reliability. Let us further examine this statement. Quantitatively, reliability is the average time over which a piece of equipment operates normally between two failures and is expressed as Mean Time Between Failures (MTBF). Maintainability is the average time to clear a fault or carry out a maintenance task and is expressed as Mean Time To Repair (MTTR). Inherent availability (Ai) considers a corrective maintenance paradigm under an idealized scenario (i.e. unlimited spare parts, unlimited skilled personnel, no administrative or logistical delays, etc), as it focuses only on design-related or manufacturing-related failures, and it is expressed as Ai = MTBF/(MTBF + MTTR). Hence, when a component is in a failed state and is no longer operating properly (i.e. decreased availability) and the length of downtime increases (i.e. decreased maintainability), then the reliability also decreases (i.e. decreased reliability).

Apart from Ai, availability should also be examined, via four other vantage points: point availability, mean availability, steady state availability, and operational availability. Instantaneous or point availability (Ap) is the probability that a component will be operational at any random time, Tr. Mean Availability (Am) is the percentage of time during a specified period of time that the component is available for use. The steady state availability (As) of the component is the limit of the instantaneous availability function as time approaches infinity (i.e. the component will eventually fail at some point). The operational availability (Ao) of the component is a measure of availability that includes all experienced sources of downtime (i.e. spare parts shortages, administrative downtime, logistical downtime, etc), and it is expressed as Ao = MTBM/(MTBM + MDT), where MTBM equates to the mean time between maintenance (i.e. which includes all maintenance performed, such as corrective, preventive, etc) and MDT equates to the mean downtime (i.e. actual time to perform the maintenance and includes any delays in obtaining the needed parts, personnel, etc). Accordingly, if Ai is examined, an increase in availability and an increase in maintainability (e.g. spare parts are indeed on hand) should lead to an increase in reliability. However, if Ao is examined and spare parts are indeed available (a seeming increase in maintainability), but the skilled personnel are not available to conduct the repair/maintenance, then there is no material change to reliability. Moreover, the MTTR of Ai should also be examined as to how many tasks need to be performed and the dependencies among the tasks. Many of the tasks may be finished quickly, but there may be critical dependencies upon various tasks, which might take much longer to finish. This constitutes a brittleness aspect to the MTTR, which corresponds to the involved complexity.

Resiliency Engineering Gauges System Brittleness Versus System Malleability

A system is deemed to be brittle if, when subjected to stress, it breaks down without exhibiting any characteristics of malleability. Malleability is a system’s ability to deform under pressure without breaking. This property is also commonly referred to as plasticity. From a systemic view, this plasticity is the intrinsic ability of a system to adjust its functioning prior to, during, and following punctuating events, such that it can sustain required operations under both expected and unexpected conditions. This is also referred to as resilience, and the distinction between high resilience and low resilience can be seen in Figure 3 below. A system with high resilience (i.e. low brittleness, high malleability) returns to the requisite functionality in a shorter amount of time than that of low resilience (i.e. high brittleness, low malleability). Hence, high resilience or low resilience is a measure of system malleability. High resilience equates to low brittleness conjoined with high malleability and low resilience equates to high brittleness conjoined with low malleability.

Figure 3
Distinction between High Resilience and Low Resilience


Resiliency Engineering Assessment Framework Builds Upon Failure Mode Effects and Criticality Analysis


A resiliency engineering assessment framework builds upon International Electrotechnical Commission (IEC) 60812, which has its origins in MIL–STD–1629 and is commonly referred to as Failure Mode Effects and Criticality Analysis (FMECA). FMECA combines Failure Mode Effects Analysis (FMEA), wherein assets undergo a single point of failure analysis, along with Criticality Analysis (CA), wherein assets are assigned a criticality rating based on their potential risk.

By way of background, FMEA is a forward logic inductive (i.e. derivation of suppositions) analytical method (i.e. single point of failure analysis) which may be performed at either the functional or component-level. It is the process of reviewing as many components and higher order multi-component assemblies, multi-assembly sub-systems, etc as possible to identify potential failure modes and the ensuing consequences. FMEA can be either qualitative or quantitative (when mathematical failure rate models are combined with statistical failure rates) and ideally would encompass both. FMEA was developed by reliability engineers to study problems that might arise from malfunctions of military systems. Ford Motor Company and other organizations applied the same approach to processes, which is known as Process Failure Mode Effects Analysis (PFMEA).

With regards to CA, there are two ways to carry out a CA. Both approaches yield a Risk Priority Number (RPN) to rank the criticality of each component. The first approach plots the severity of a given consequence (X axis) against the probability of that consequence occurring (Y axis). The second approach is to separate the consequence categories by type. Typically, there is an organic FMECA document accompanying a system.

Resiliency Engineering Assessment Framework Builds Upon Both the Inductive and Deductive Analytical Methods


A resiliency engineering assessment framework is able to leverage not only the inductive analytical method of FMEA, but also the deductive analytical method by reverse engineering recitals of facts or effects. The ensuing failure analysis or fault tree analysis (FTA) facilitates the assessment to more closely scrutinize RAM, among other items.

A Fault Tree (FT) is a top-down logical diagram that displays the varied relationships among a higher-level failure state and its lower-level causes. A Fault Tree Analysis (FTA) is comprised of the qualitative and quantitative analyses that can be carried out based upon the FT. In essence, FTA is a top-down, deductive failure analysis, wherein the higher-level failure state of the system is analyzed, via boolean logic (i.e. true/false or 1/0), and by lower-level events. FTA facilitates the creation of a series of statements based upon boolean logic, and when these statements are sequenced together, they form a logic diagram of failure. Statements or events are arranged in sequences of either series relationships (i.e. ‘or’) or parallel relationships (i.e. ‘and’).

FTA traverses a logical decomposition from the top-level failure state event down to the bottom-level event. Each traversal is a pathway, which has a probability assigned to it. Pathways can be ranked according to severity and prioritized for mitigation. Starting at the bottom-level (i.e. base-level) event and working the pathway up to the undesirable top-level (i.e. failure state-level) event is referred to as a Cut Set (CS). There are many CSs within the FTA. Typically, the FTA involves: (1) identifying the failure state, (2) obtaining an understanding of the system being analyzed, (3) creating the FT, (4) identifying the CSs, and (5) identifying mitigation pathways.

To obtain an understanding of the system being analyzed, the following are typically needed: (1) list of components (i.e. bill of materials), (2) boundary diagram (i.e. a graphical illustration of the relationships among the components, multi-component assemblies, multi-assembly sub-systems, systems, and system of systems as well as the interfaces with neighboring systems and environments, such as can be seen in Figure 7 below), (3) schematics and diagrams, (4) regulatory requirements, (5) engineering environments and interference (such as can be seen in Figure 8 below), and (6) similar failures (e.g. blind shear ram failure from the Deepwater Horizon case study, O-ring failure from the Space Shuttle Challenger case study, etc).

Figure 4
Studied System and Neighboring Systems & Environments


Figure 5
Engineering Environment and Interference


Resiliency Engineering Assessment Framework Segues to Various Failure Analyses


With FTA, the resiliency engineering assessment framework segues to various failure analyses, which includes, among other analyses, Failed-Part Analysis (FPA) and Root-Cause Failure Analysis (RCFA). These analyses are construed to reside within the field of Resiliency or Malleability Analytics. FPA refers to the process of analyzing component data or the component itself to ascertain the reason(s) for degraded performance and/or catastrophic failure. RCFA refers to the investigative process utilized to ascertain the underlying event(s) responsible for the studied failure(s). Failures can stem from a variety of factors ranging from component failure to an improper engineering process. RCFA is comprised of the following steps: (1) identify and describe the event, (2) establish a timeline from a baselined situation up to the time the event occurred, (3) distinguish between the root cause and other causal factors utilizing event correlation (necessitates robust timestamping), which is a technique for making sense of a large number of events and pinpointing the few causal events, and (4) establish a causal graph (a visual representation of the causal assumptions so as to derive effect implications, estimate effect sizes, and manage missing data and selection bias) between the root cause(s) and the failure event(s).

Causal graphs can include, among others, Directed Acyclic Graphs (DAGs), Bayesian network diagrams, etc. A DAG is a finite directed graph (each edge is traversed in the same direction) with no directed cycles (whose first and last vertices are the same). A Bayesian network diagram (a.k.a. Bayes network, belief network, causal network, decision network) is a probabilistic DAG (PDAG), wherein pathways have multivariate probability distributions. While the DAG, PDAG, and other path diagrams are indeed directed, we provide an extended causal graph in Figure 6, wherein it is understood that each edge is directed and traversed in the same direction. We then provide a corresponding subset probabilistic causal graph in Figure 7. The same information, via a varied vantage point, is delineated in Figure 8. It should be clear that RCFA is vital for recommending action plans so as to prevent future [repeated] failures.

Figure 6
Extended Causal Graph


Figure 7
Probabilistic Causal Graph


Figure 8
Varied Vantage Point of Probabilistic Causal Graph


Resiliency/Malleability Analytics as a Key Tool for Resiliency Engineering


Resiliency/Malleability Analytics involves the analysis of each asset for potential impacts (via reliability measurements and forecasts) and resiliency opportunities. Overall, resiliency/malleability analytics endeavors to discern the changing shape of potential failures before breakdowns happen, particularly if they have occurred before. Breakdowns can lead to adverse operational and even safety problems. The utilization of resiliency/malleability analytics for certain high-risk industries (e.g. space travel, aviation, etc) has already led to demonstrated value, such as enhanced reliability of the involved system. It has also led to opportunities to better understand interconnected systems and to reduce the possibility of cascading failure. International organizations are stating that these efforts — to make critical infrastructure more resilient to punctuating events and uncertainties — represent the engineering component of sustainability.

The complexity of current and future socio-technological environments necessitates the notion of a High Reliability Organization (HRO). An HRO is sometimes characterized as a learning organization, which has the ability to adapt to changes and disturbances by restructuring itself as an essential socio component of the involved “resilient system.” Also, HROs are increasingly turning to Reliability-Centered Maintenance (RCM) as a first step on their pathway toward becoming more resilient. Other steps on the pathway include observance of standards. The International Organization for Standards (ISO) 55000 is an international standard covering management of assets of any kind. Its predecessor was the Publicly Available Specification (PAS 55) [for physical assets], which was published by the British Standards Institution in 2004. The PAS 55 gave guidance and a 28-point checklist of best practices relevant to critical infrastructure (e.g. electrical utilities, air transport systems, etc.). In essence, the PAS 55 is a Plan-Do-Check-Act cycle of continual improvement. In January 2014, the ISO 55000 series of Asset Management standards was launched. In November 2018, a revised and expanded version ISO 55002:2018 was released (it was based upon the experiences of successful early adopters of ISO 55001 in over thirty countries; ISO 55001 had been released to establish specific requirements for not only implementing and maintaining an asset, but also improving that asset). ISO 55002:2018 also focuses upon the four fundamentals of asset management: Value, Assurance, Alignment, and Leadership. Value refers to the fact that an asset exists to provide value to the system. Assurance refers to the fact that assets will fulfill their required purpose. Alignment refers to the fact that asset management should properly translate the system's core objective into technical and financial decisions and plans. Leadership refers to the workplace culture as a determinant of the realization of Value. In September 2019, ISO/TS 55010:2019 was released. It furthers the fundamentals of Value, Assurance, Alignment, and Leadership underscored by ISO 55002:2018.

Our Resiliency Engineering Software and Assessment Framework are a Highly Effective Combination


Modern-day infrastructural ecosystems are complex, and Resiliency Engineering is invaluable amidst these "digital fog" environs.


Resiliency Engineering Builds upon the discipline of Reliability Engineering, which is a sub-discipline of systems engineering.


A robust Resiliency Engineering Assessment Framework builds upon Failure Mode Effects and Criticality Analysis.


A robust Resiliency Engineering Assessment Framework Builds upon both the Inductive and Deductive Analytical Methods.


The Resiliency Engineering Assessment Framework approach to Failed-Part Analysis segues to various pertinent failure analyses, which inform Root-Cause Failure Analysis.


The Resiliency Engineering Assessment Framework approach to Root-Cause Failure Analysis gauges System Brittleness versus System Malleability.


Resiliency/Malleability Analytics is a key tool for Resiliency Engineering, as it provides both quantitative and qualitative insights, which can inform mitigation actions.


Resiliency Engineering Software and Assessment Framework-based Resiliency Engineering Consulting Services can be a highly effective combination for enhancing resiliency.